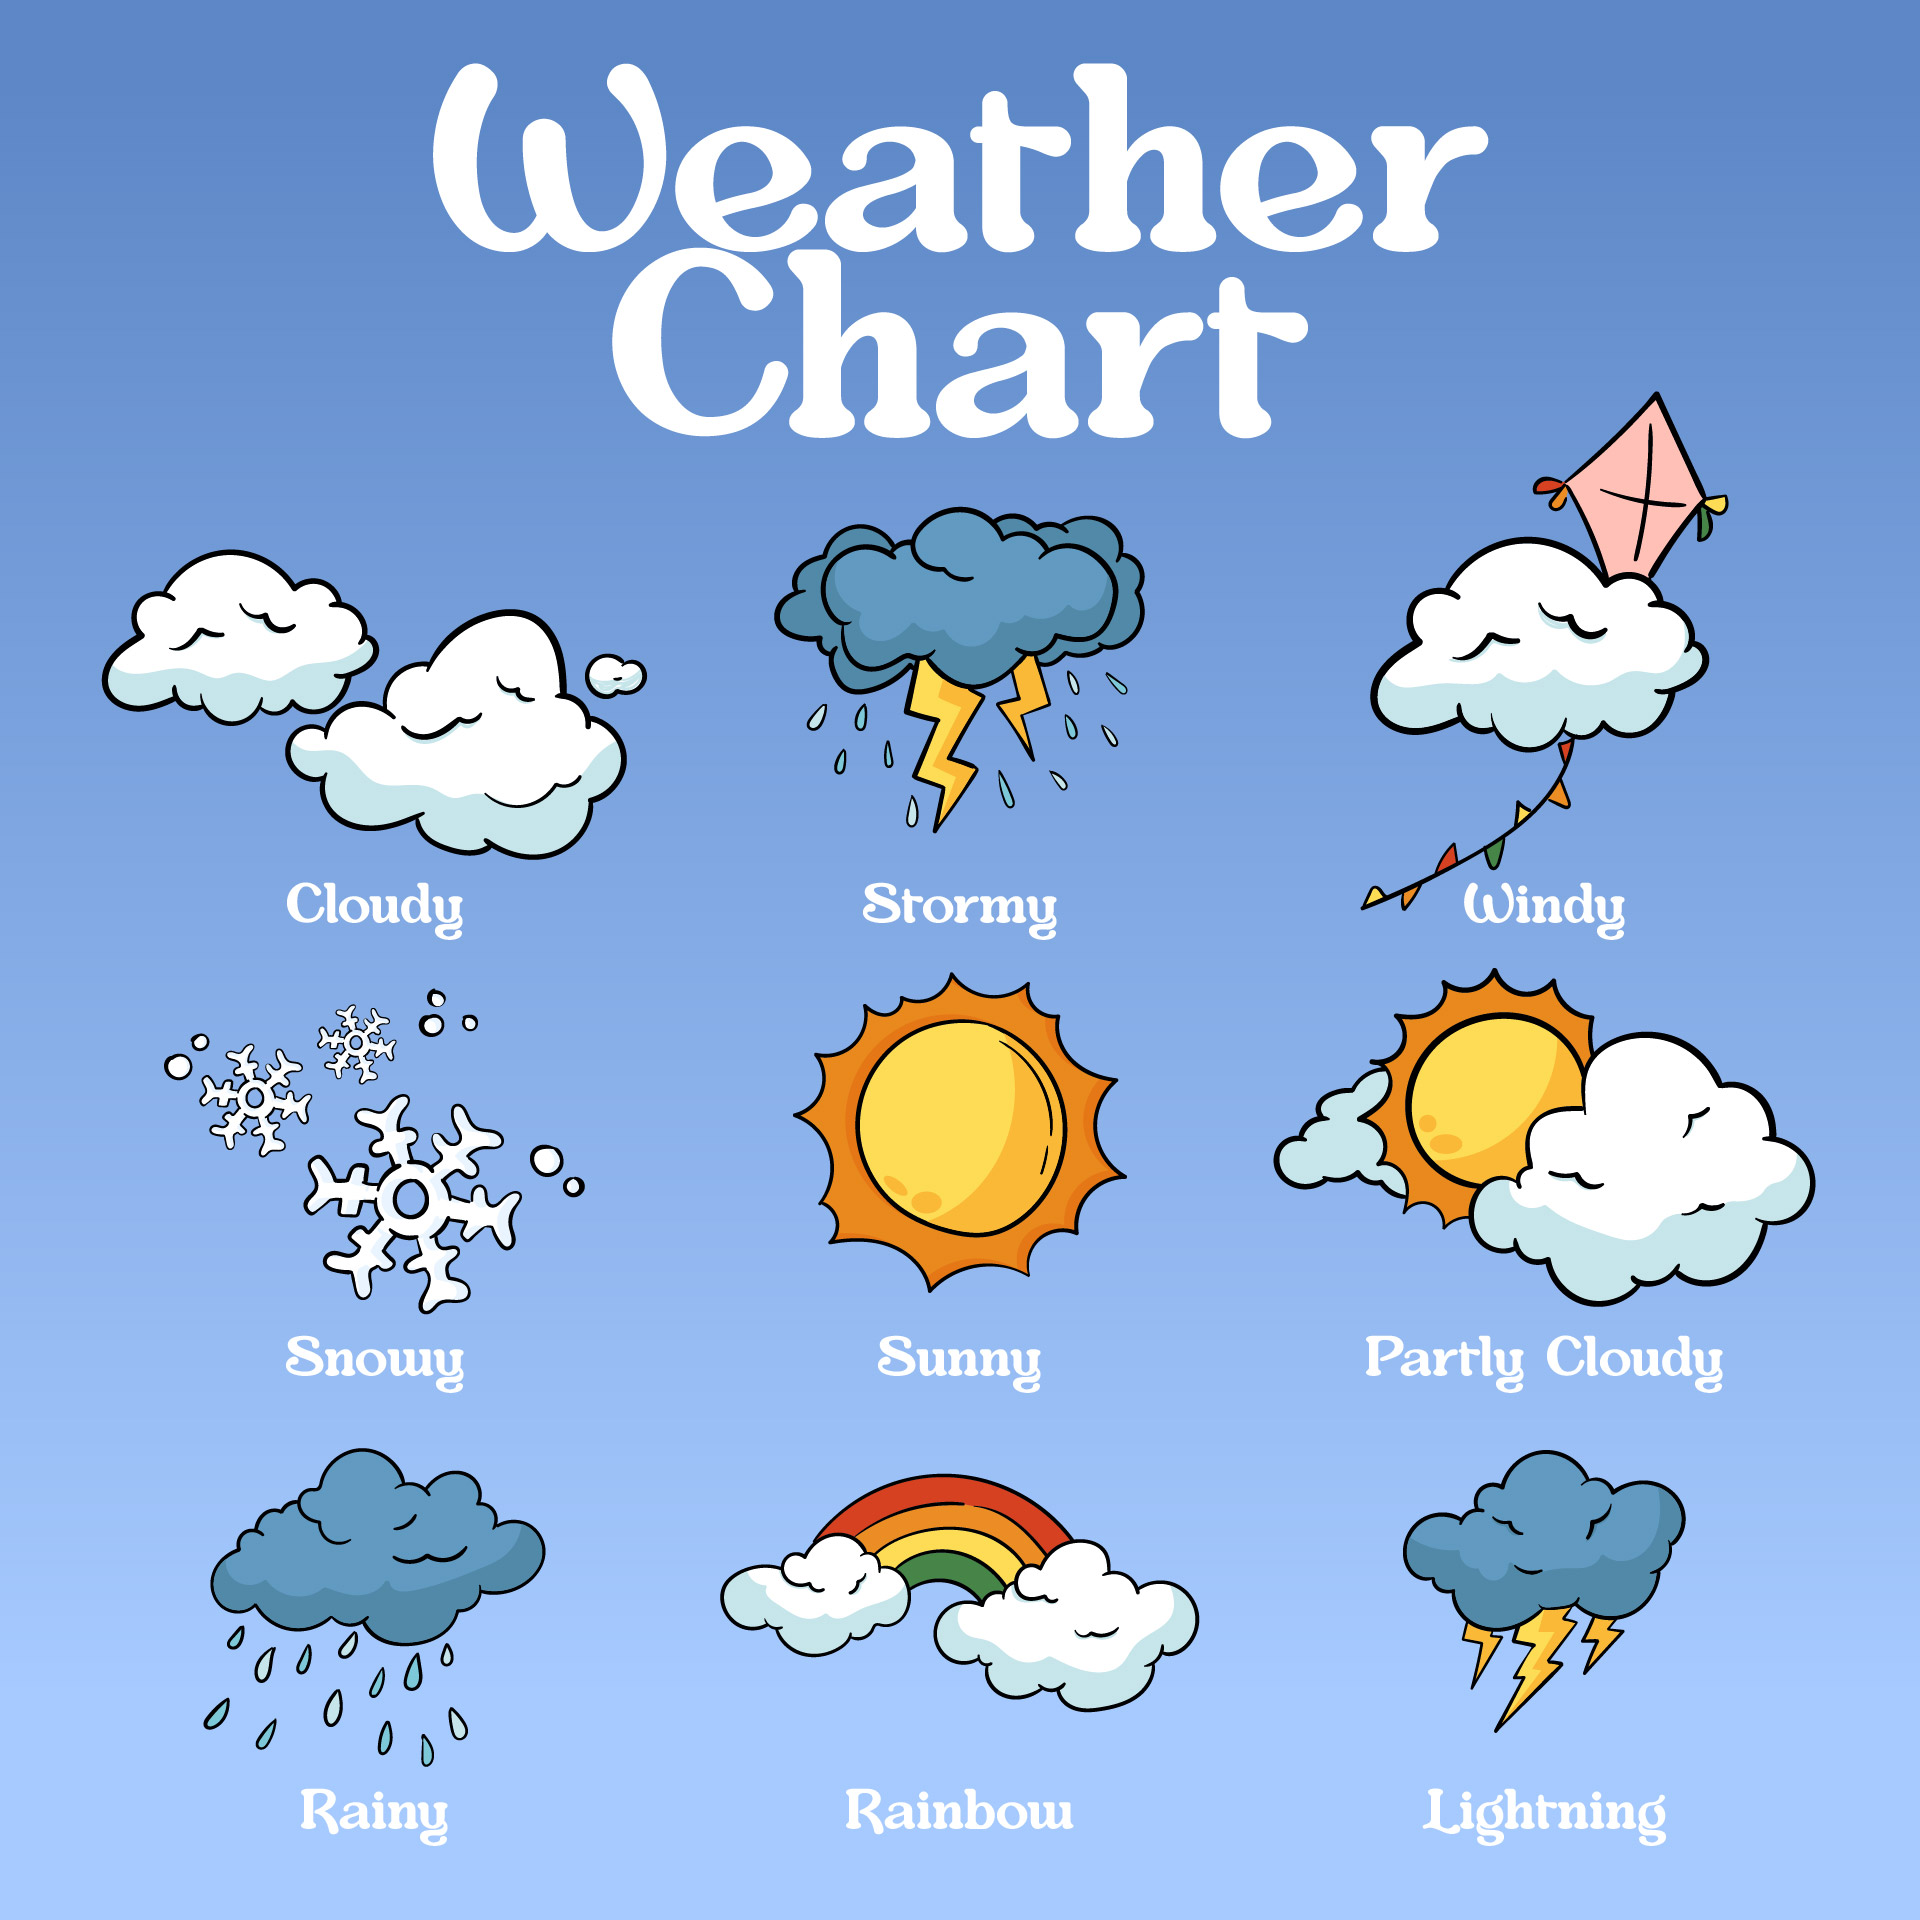
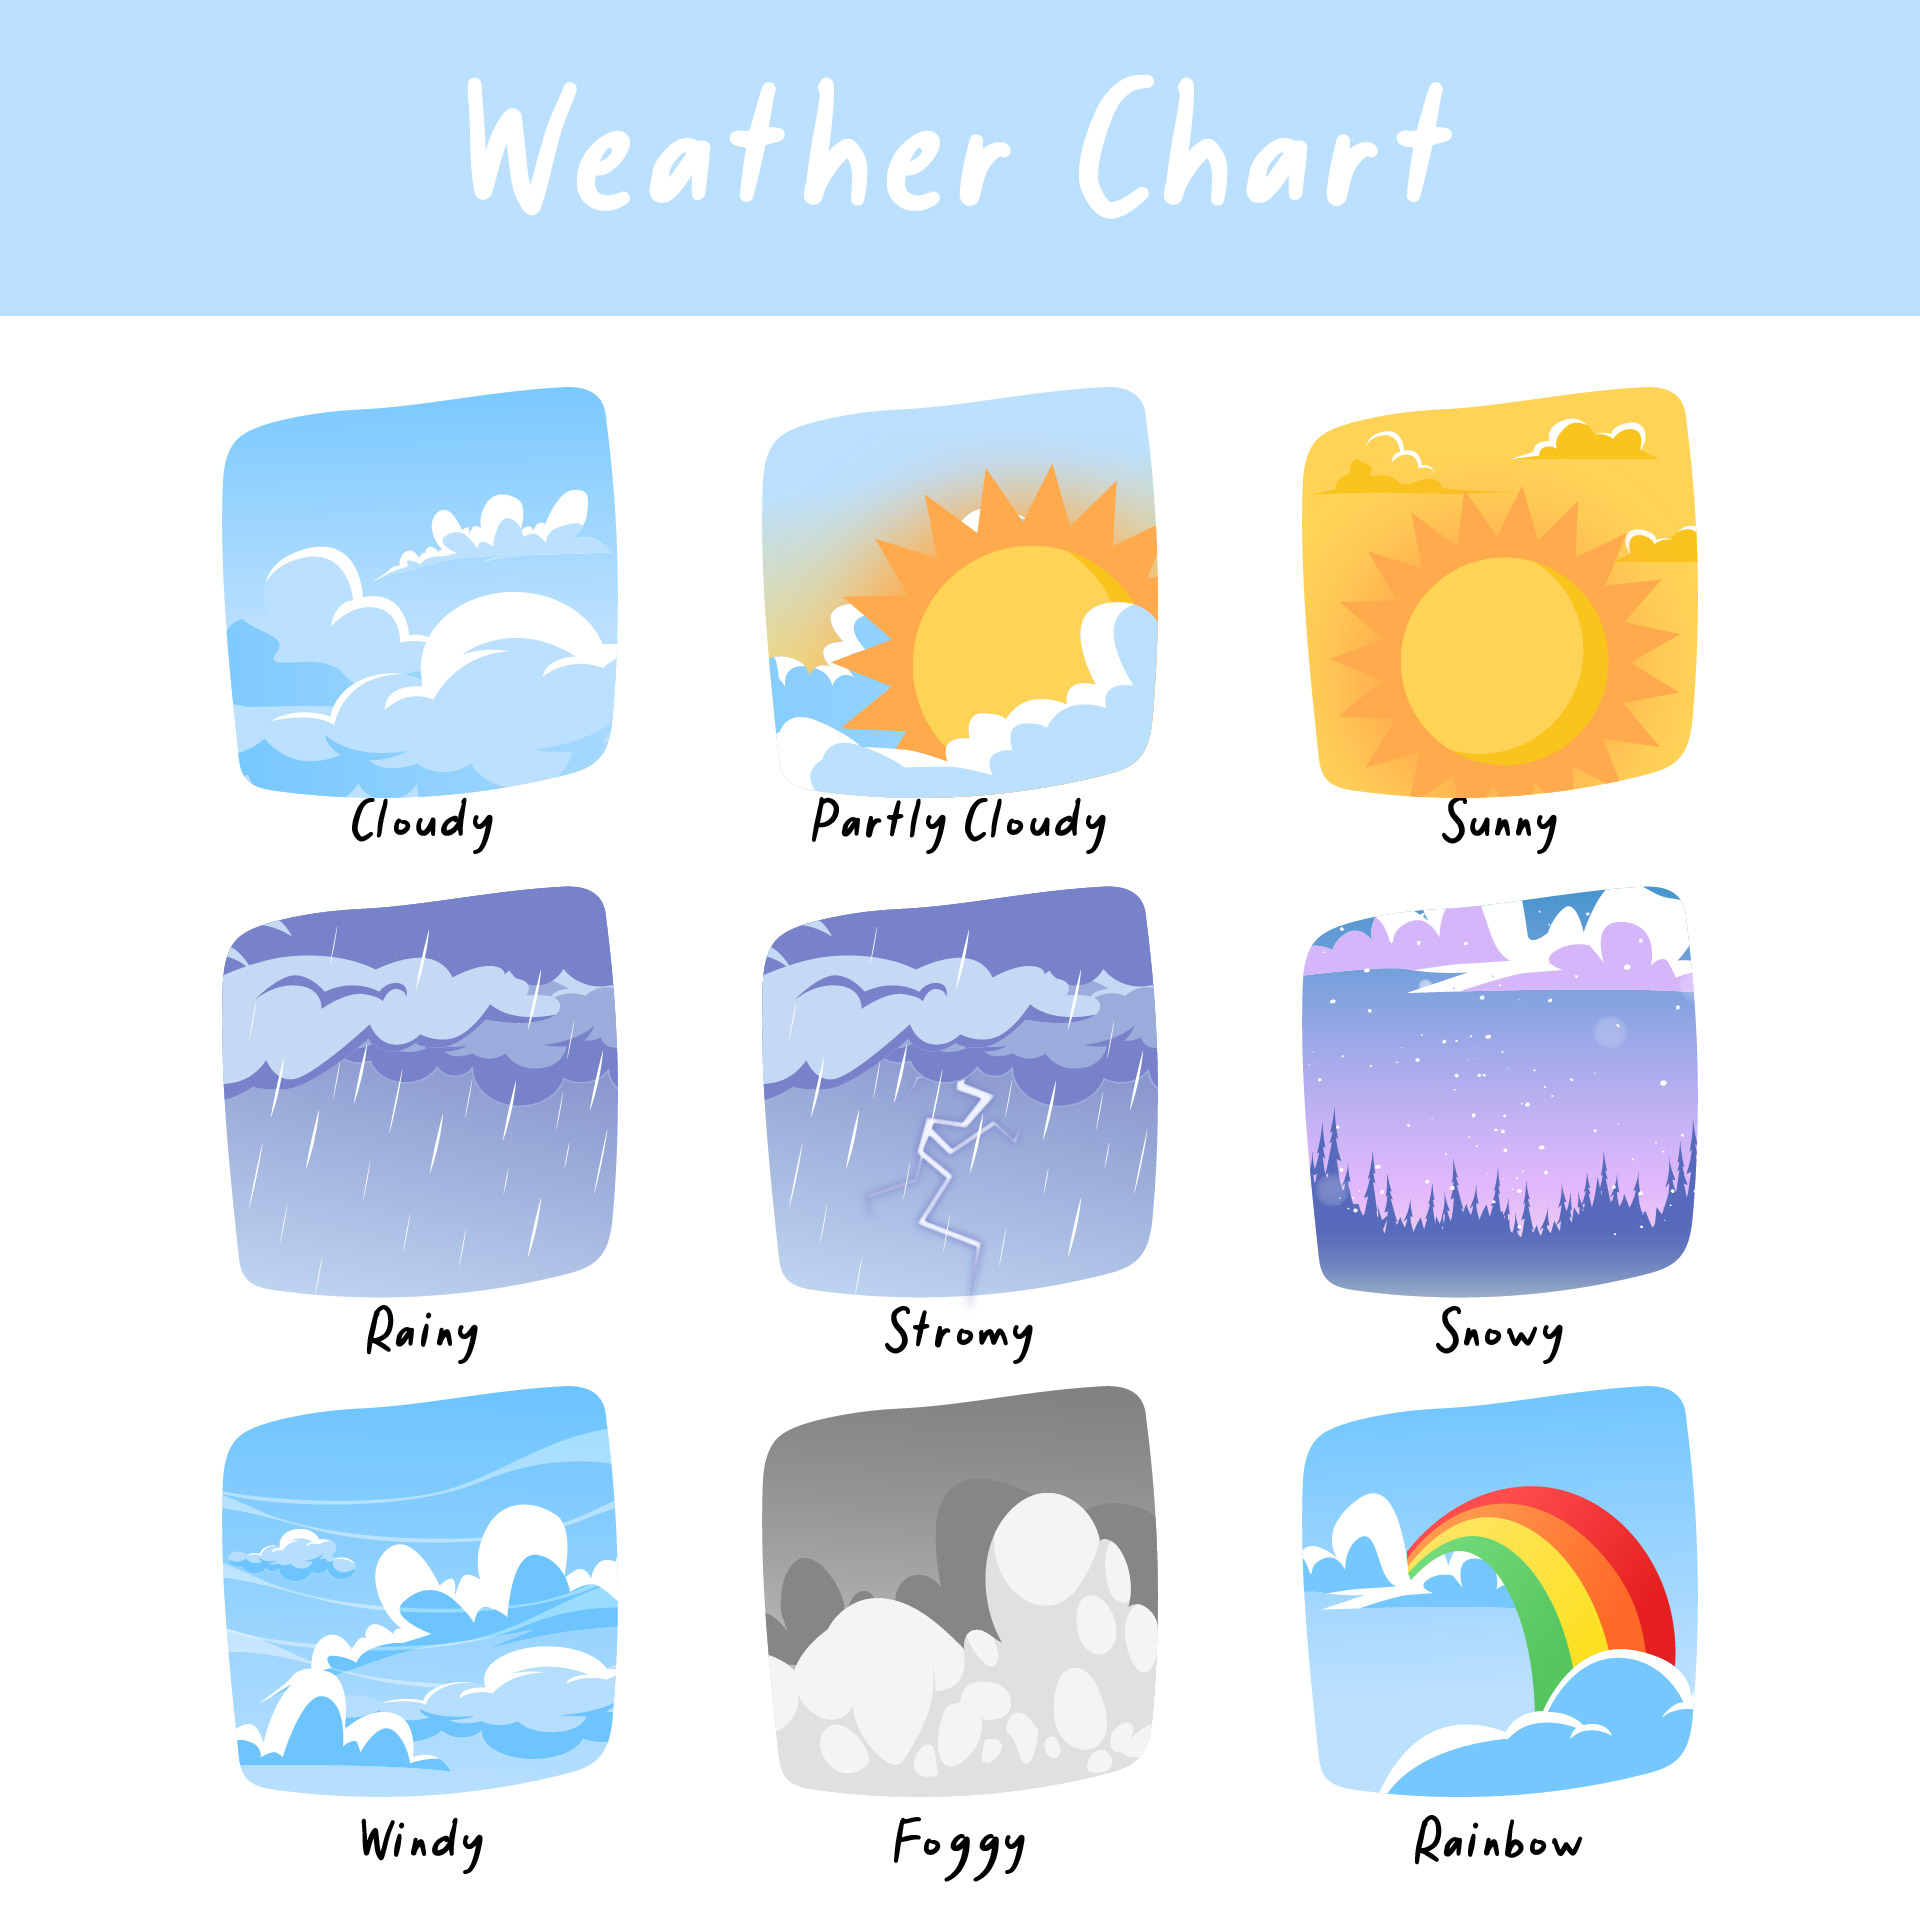
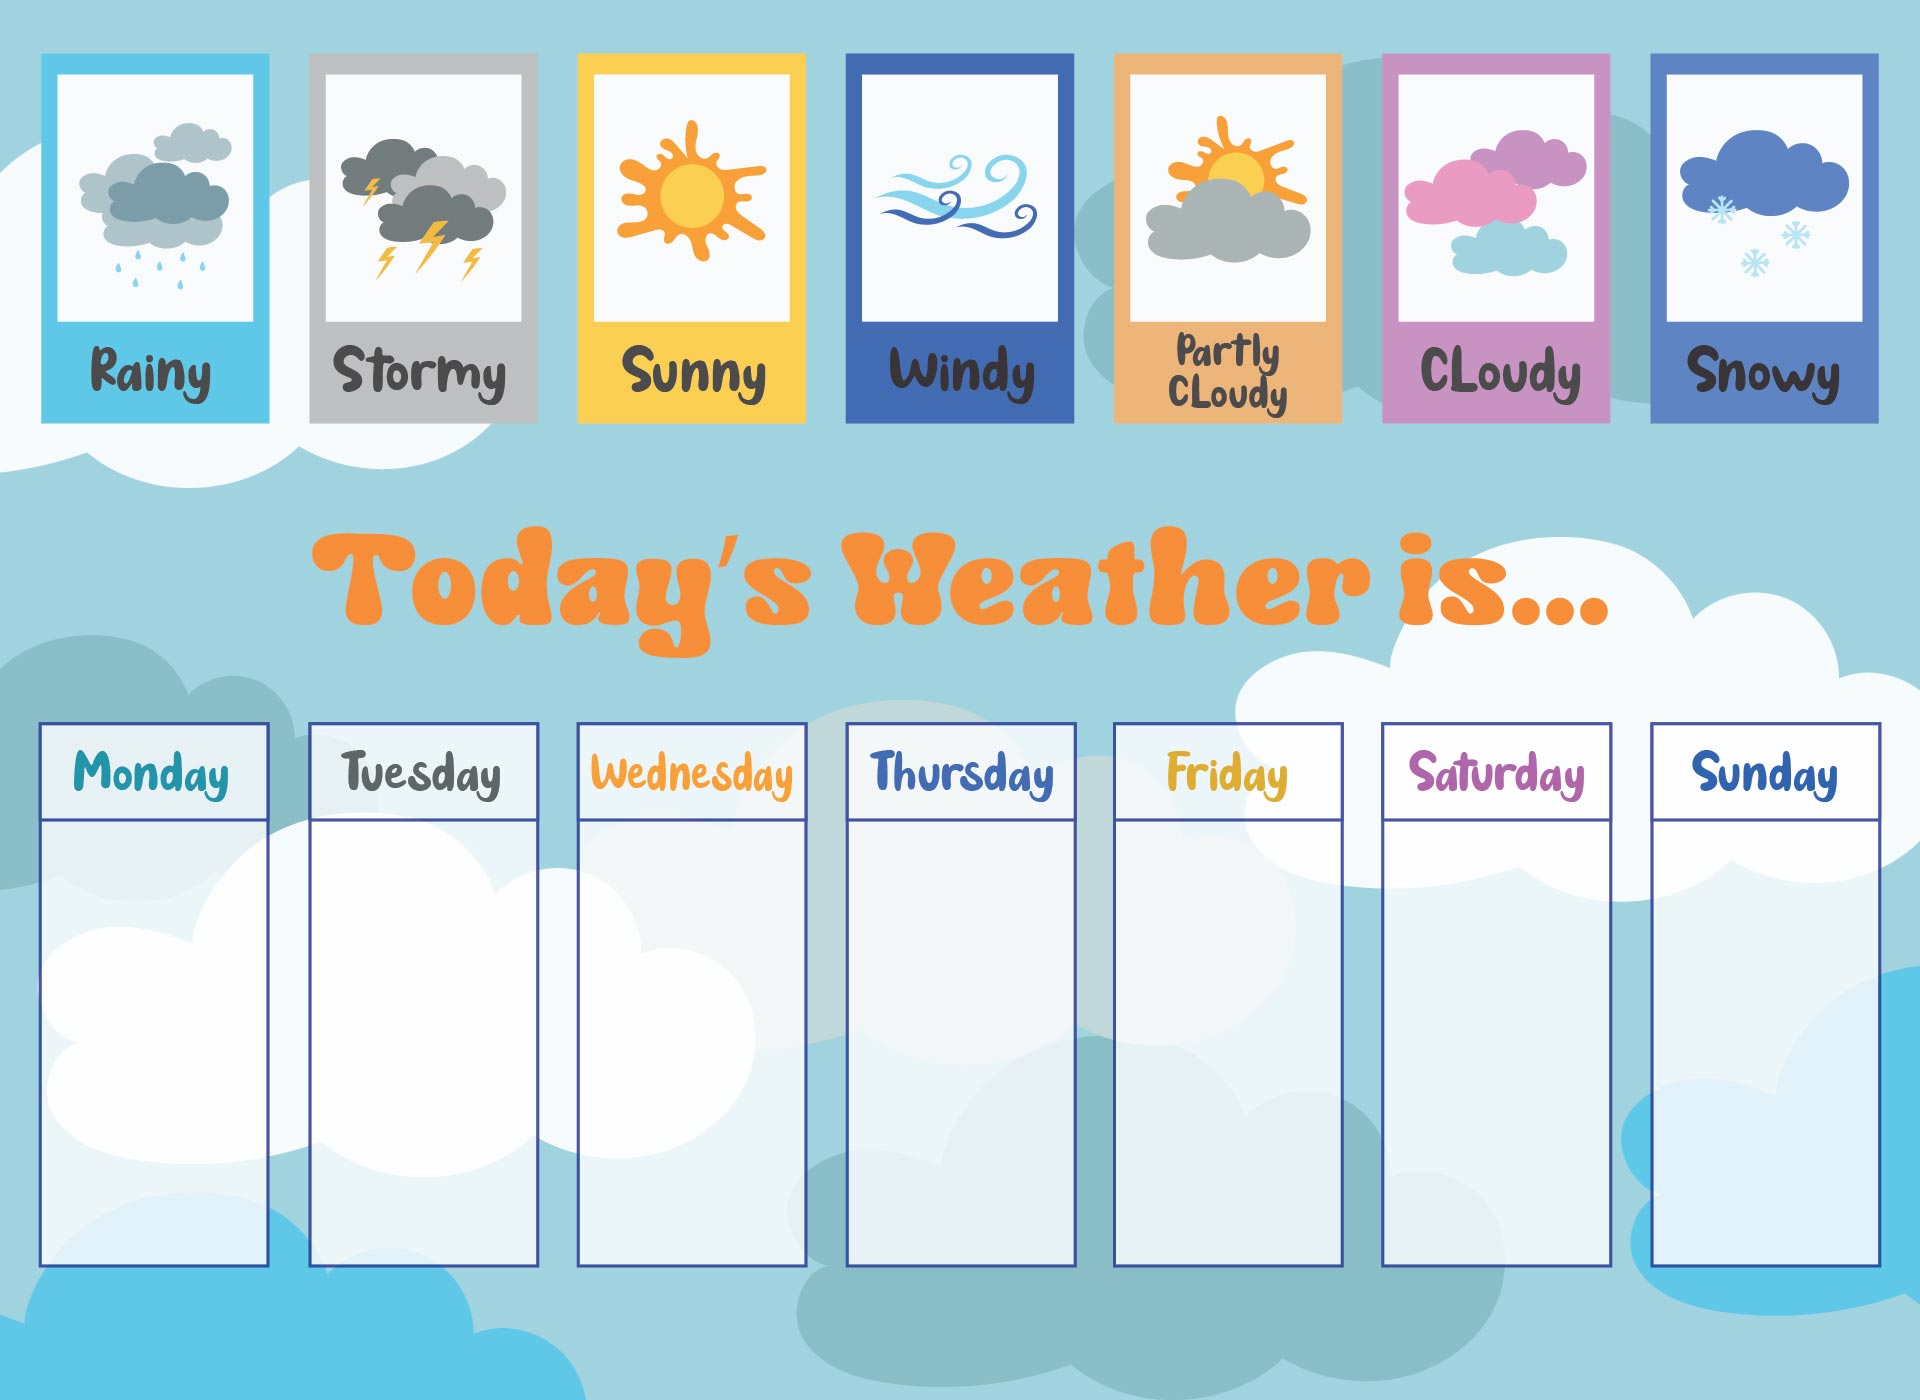
Teachers in kindergarten often struggle with teaching weather concepts in an engaging way. They need tools that make learning interactive and fun for young learners. Finding a way to track and discuss weather daily can be a challenge without the right resources. Printable weather charts are seen as a practical solution to help kids understand and visualize weather patterns while enhancing their vocabulary and observational skills.
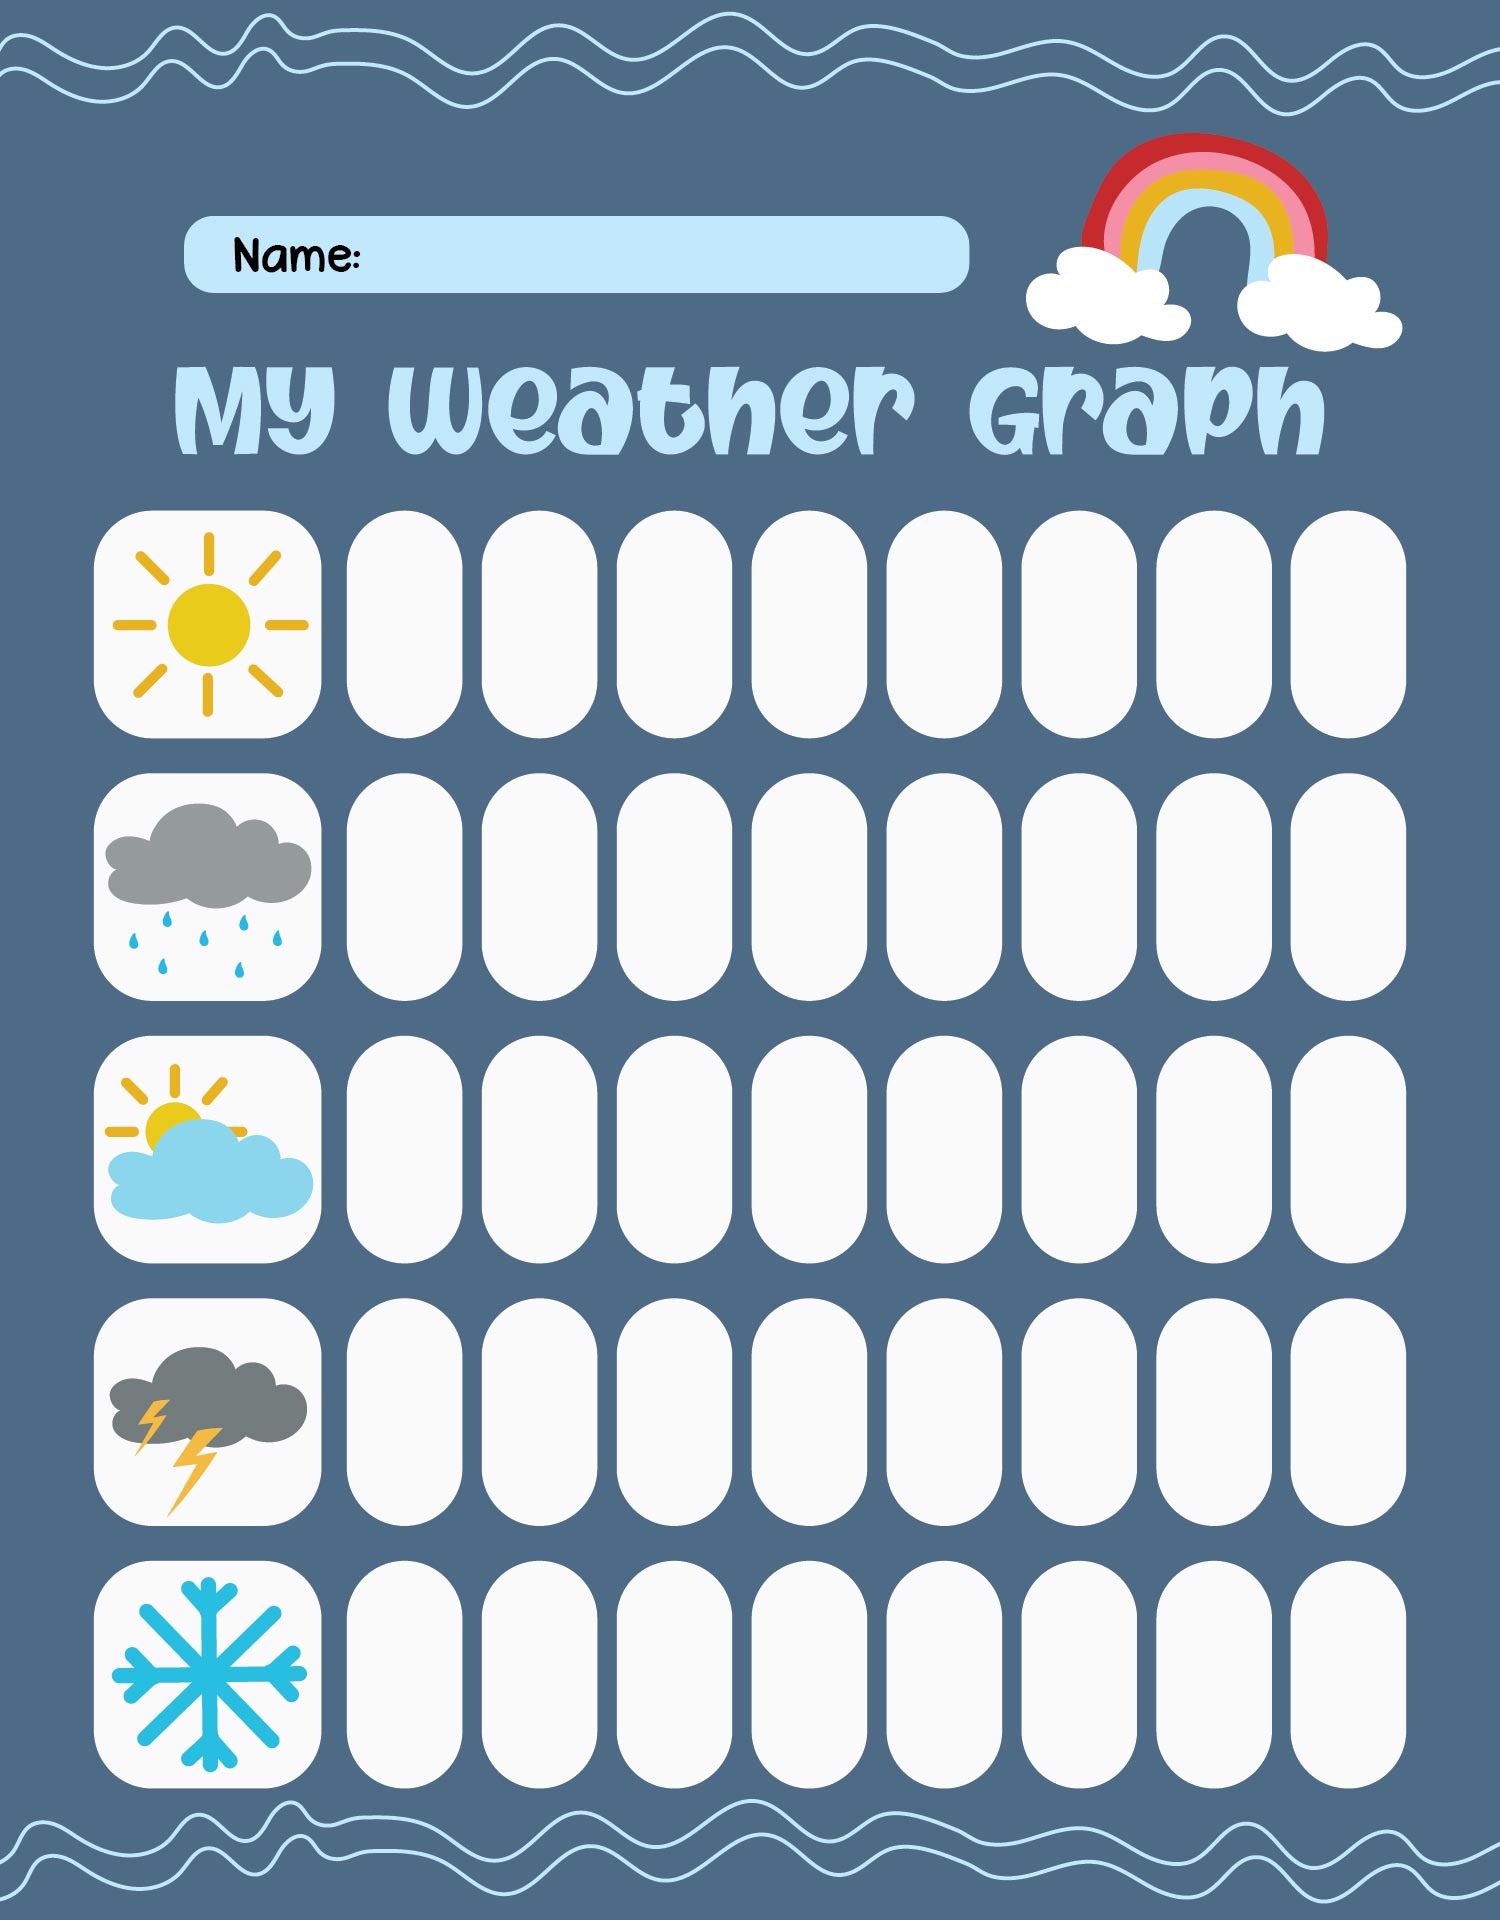
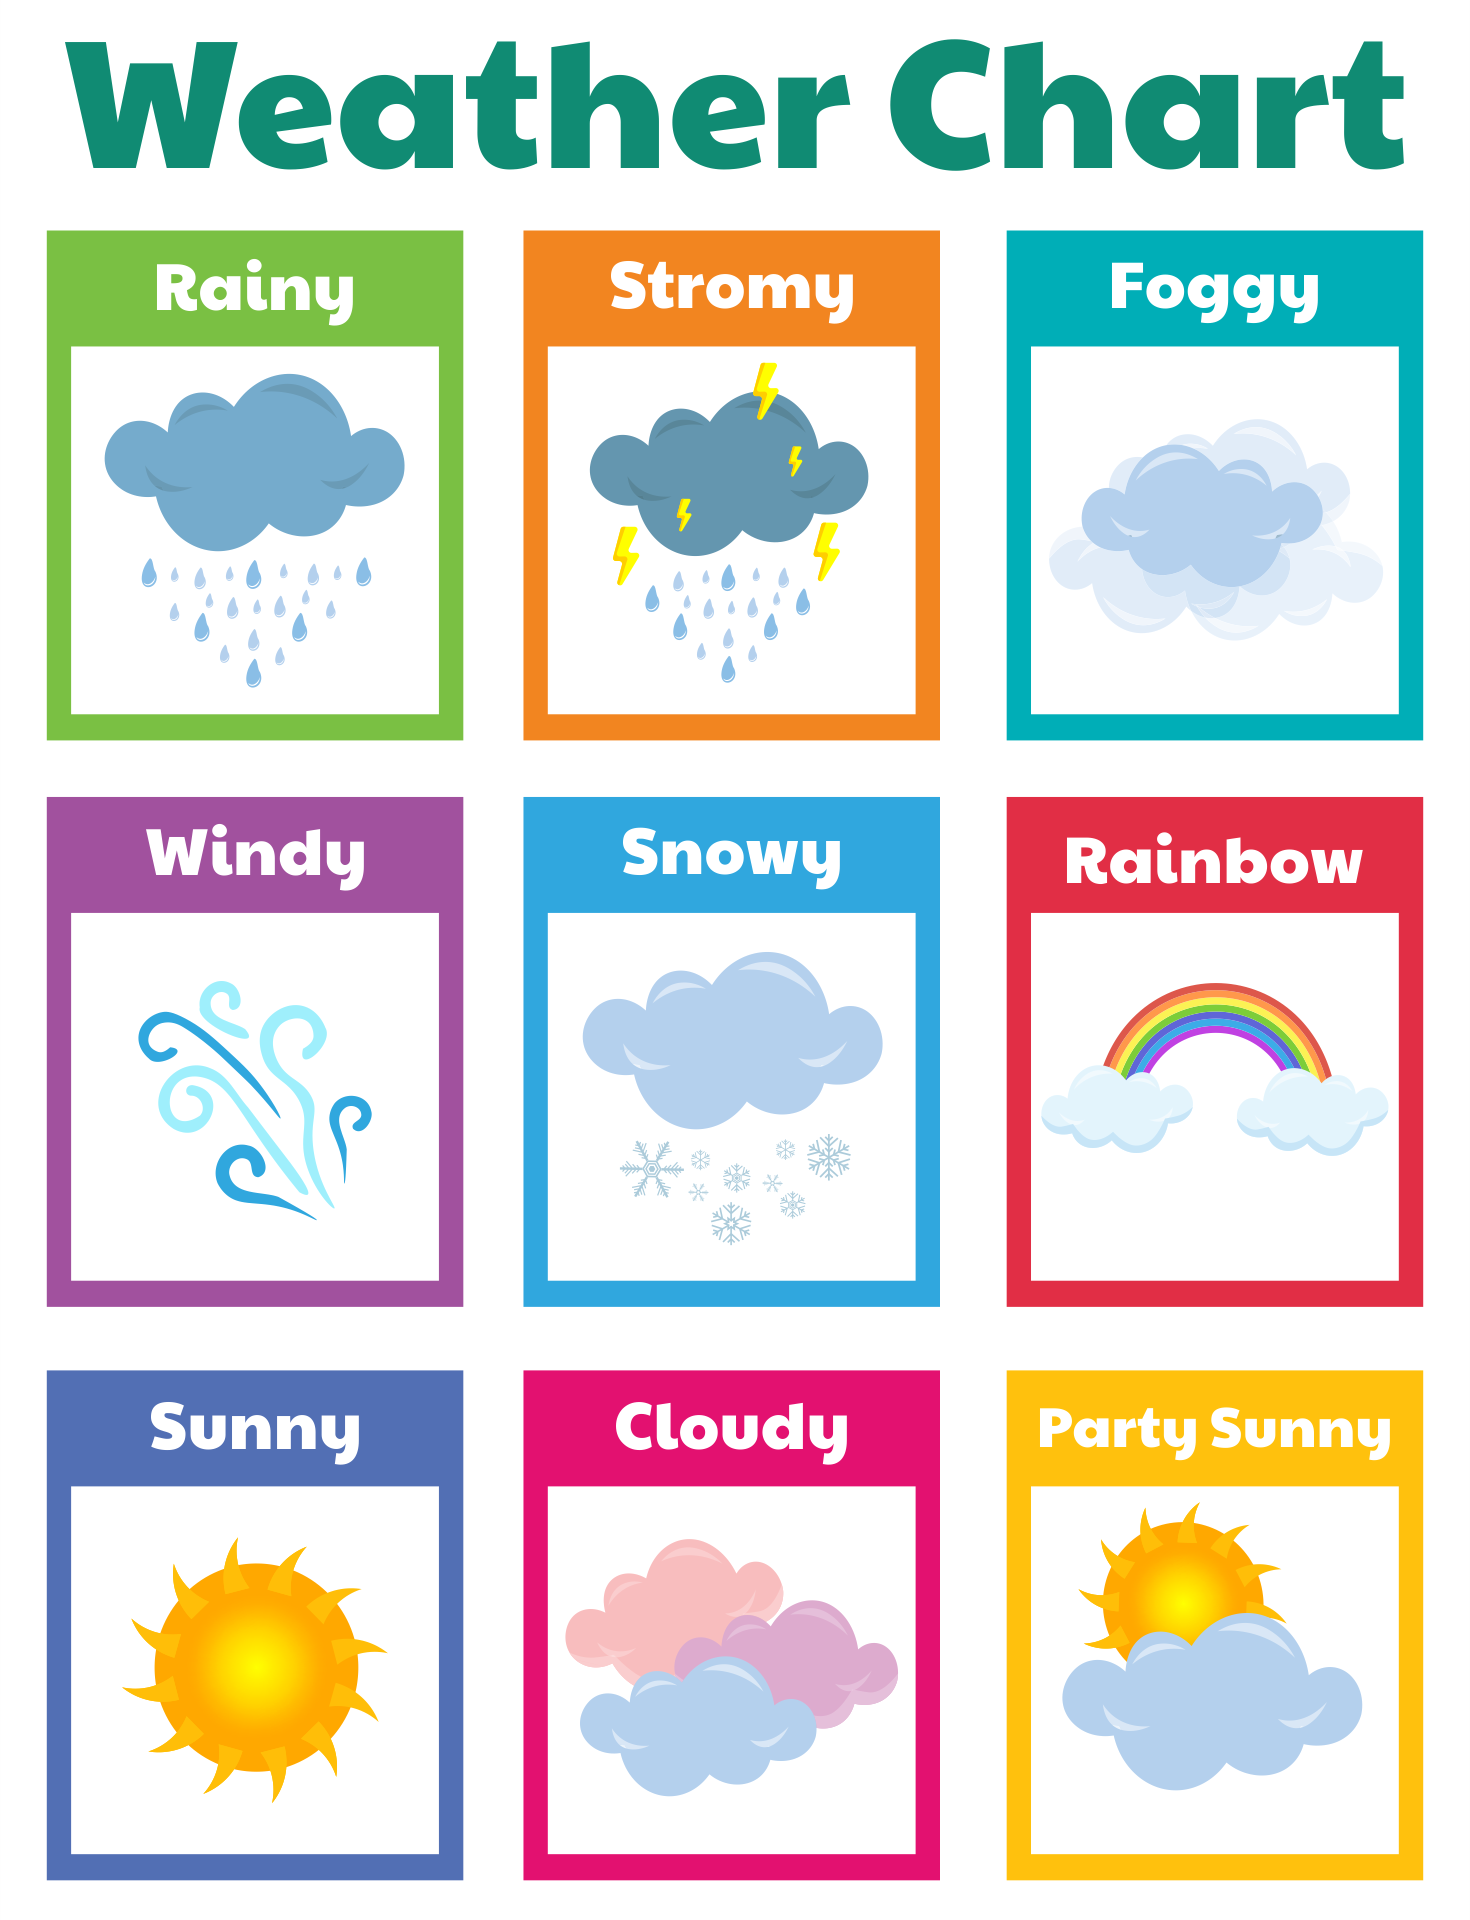
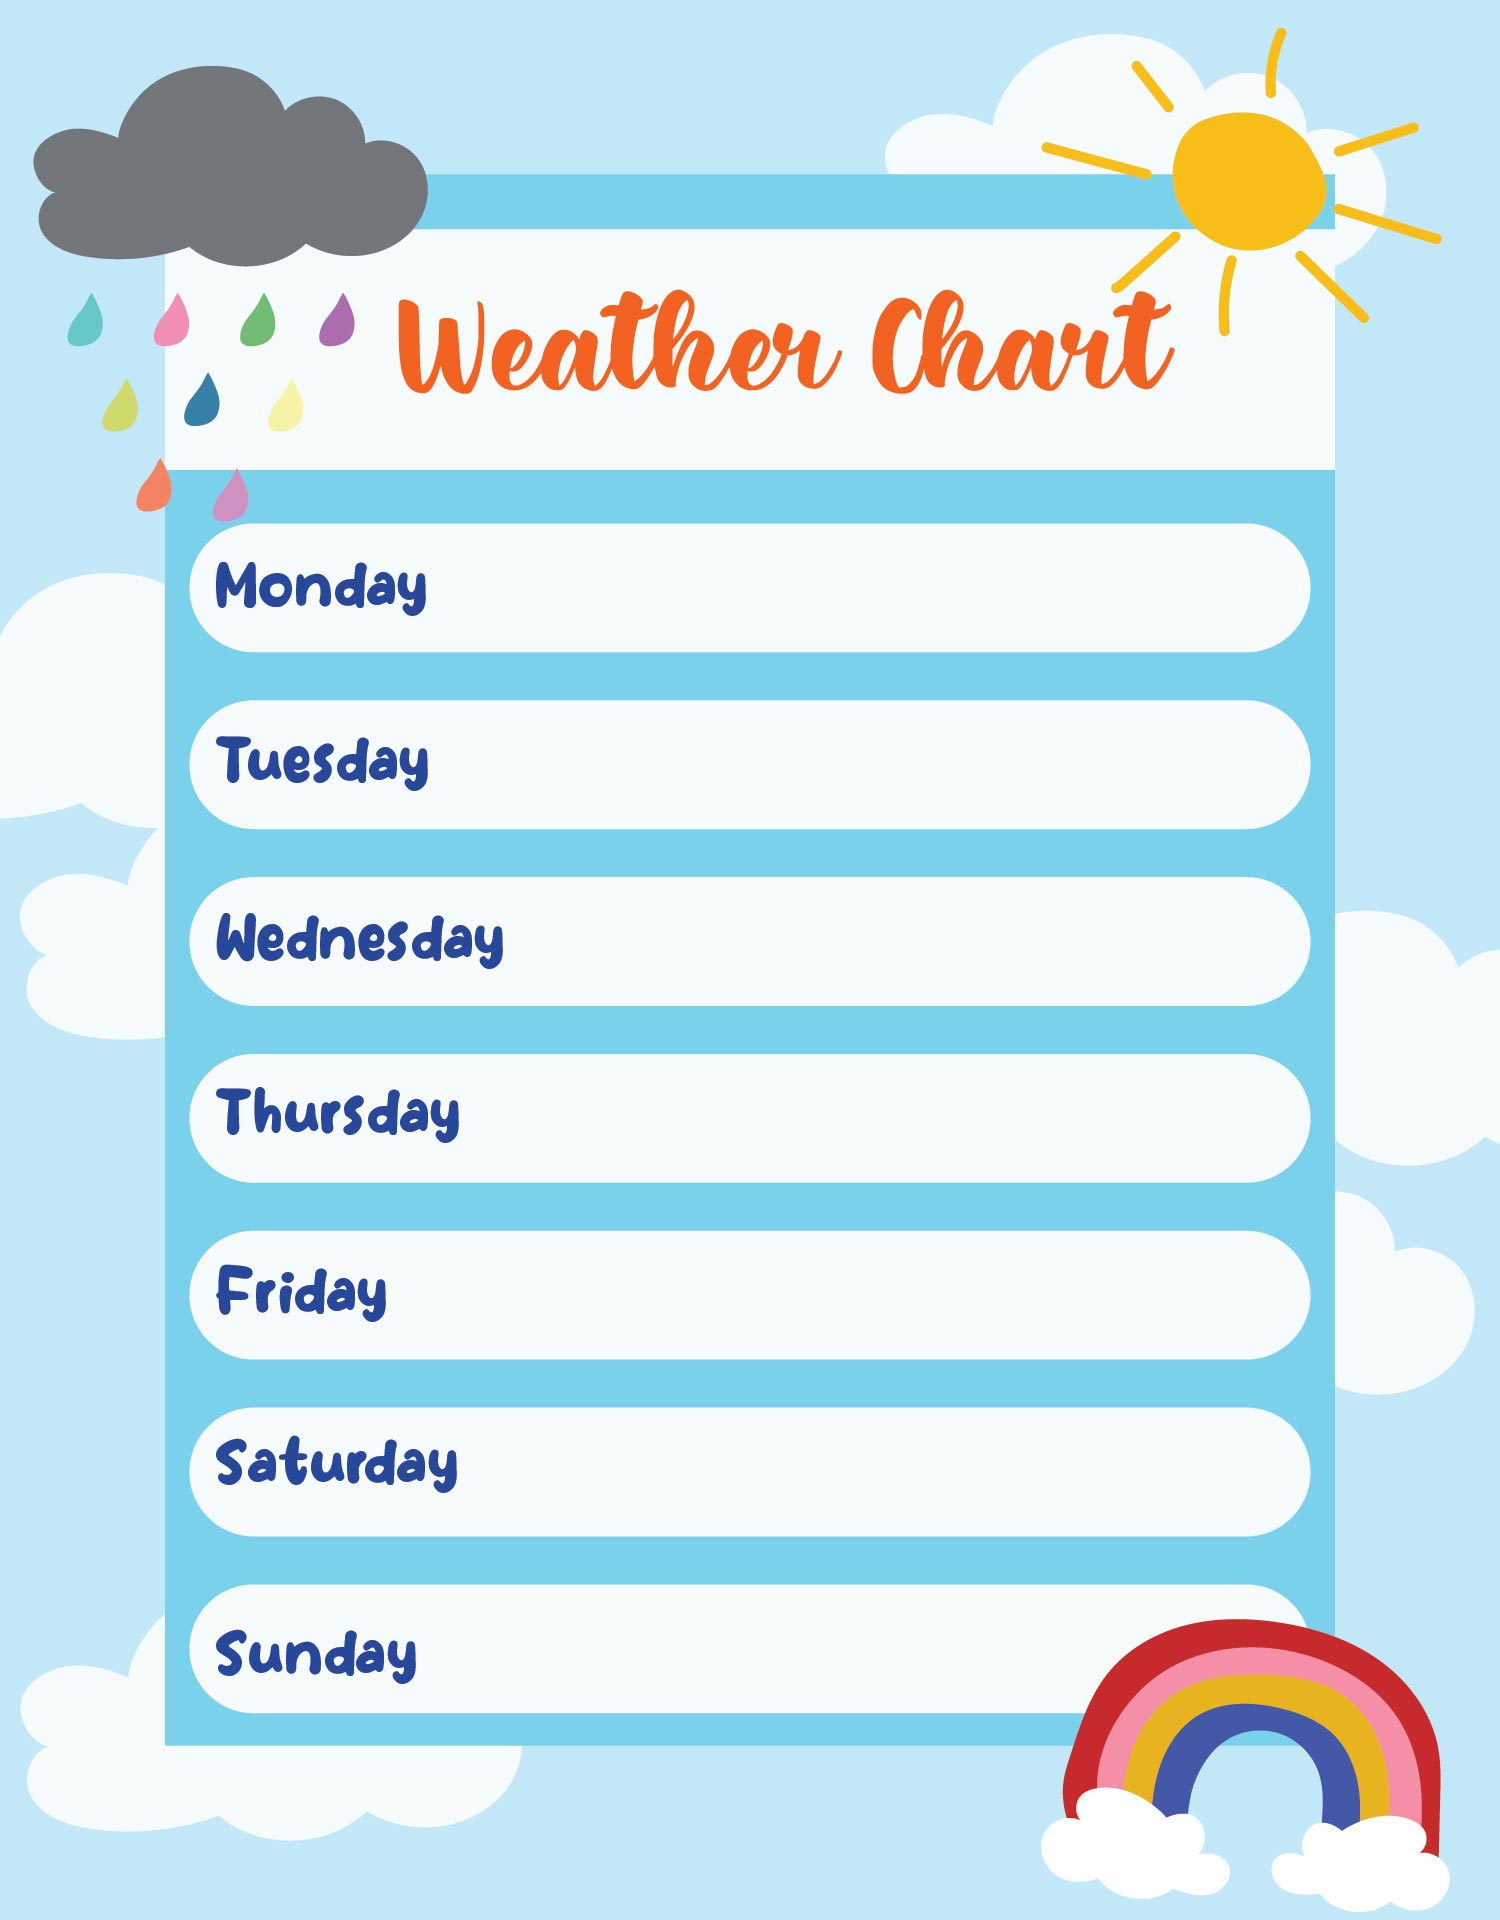
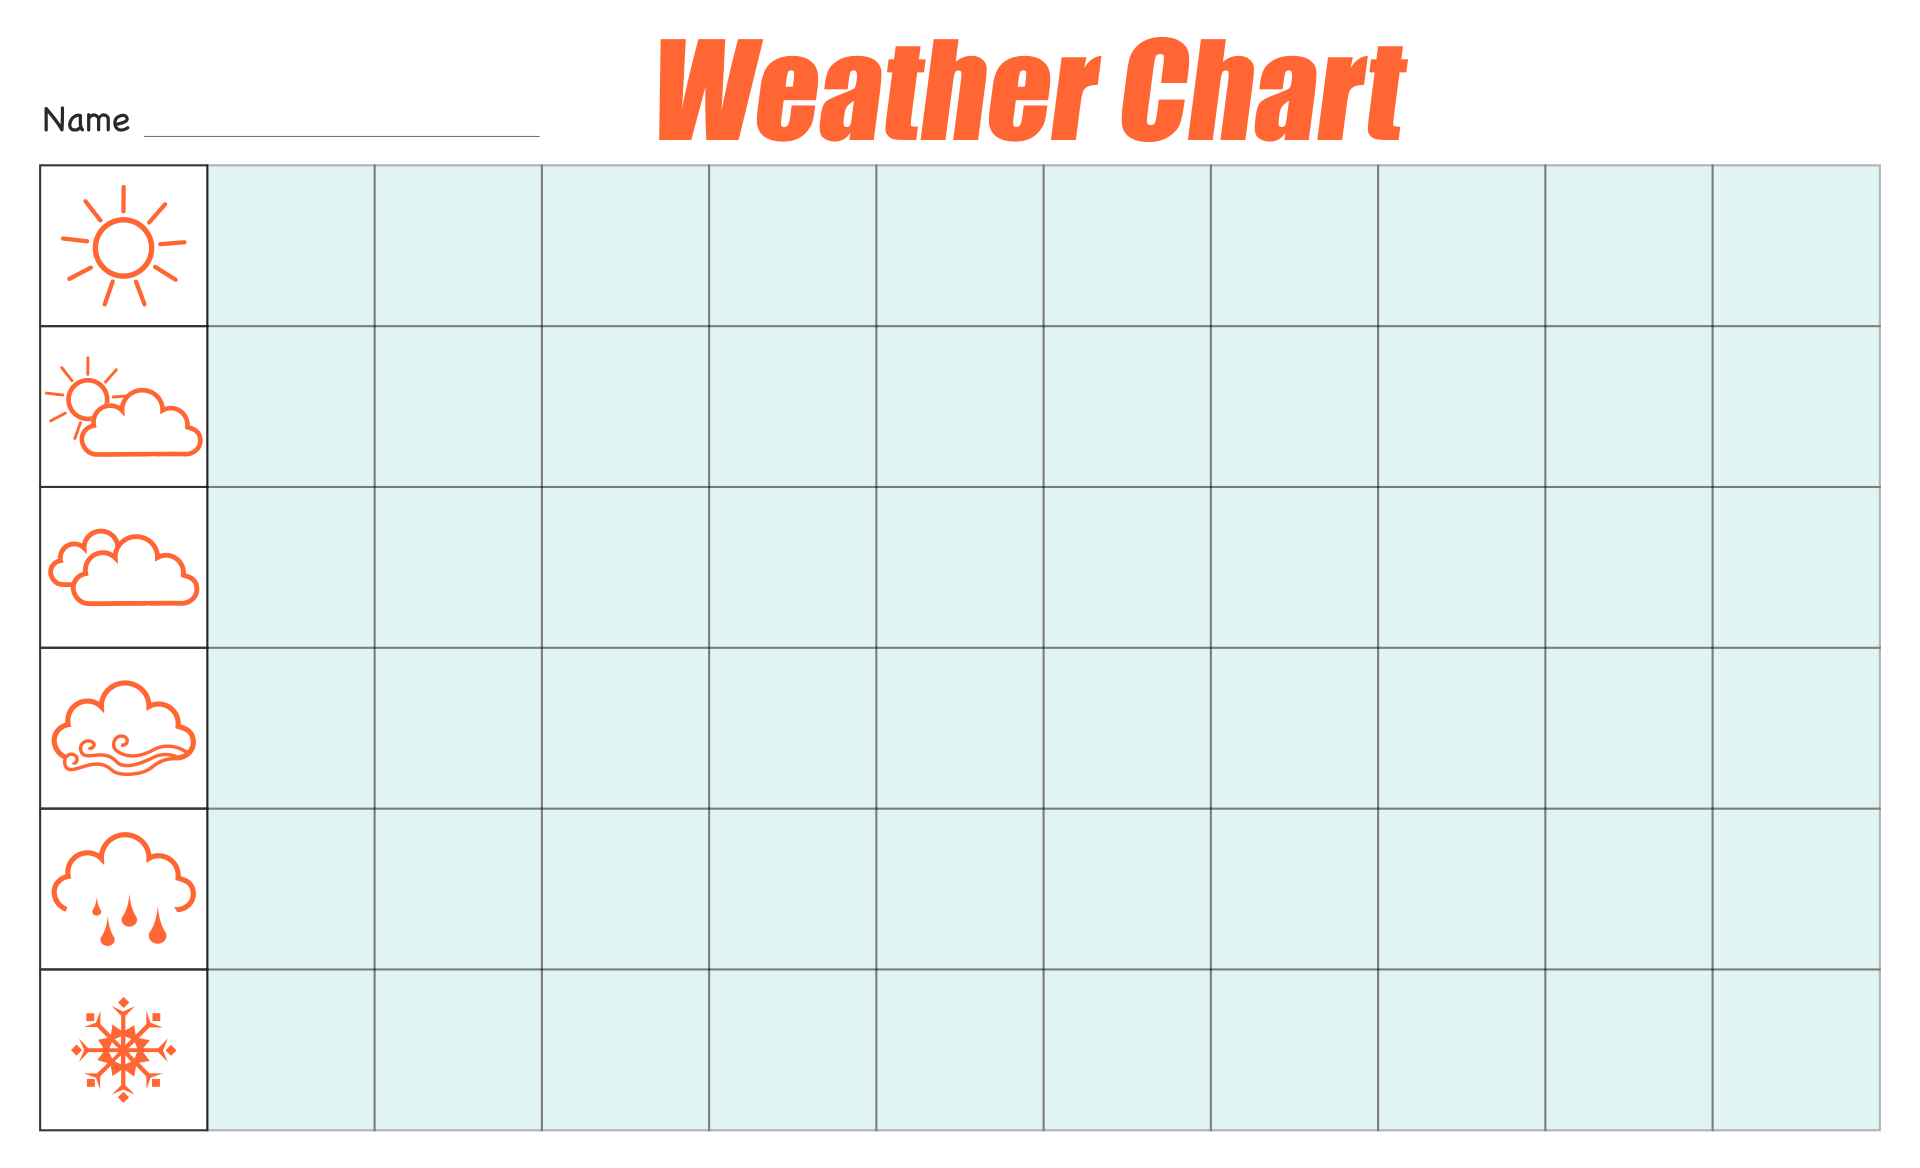
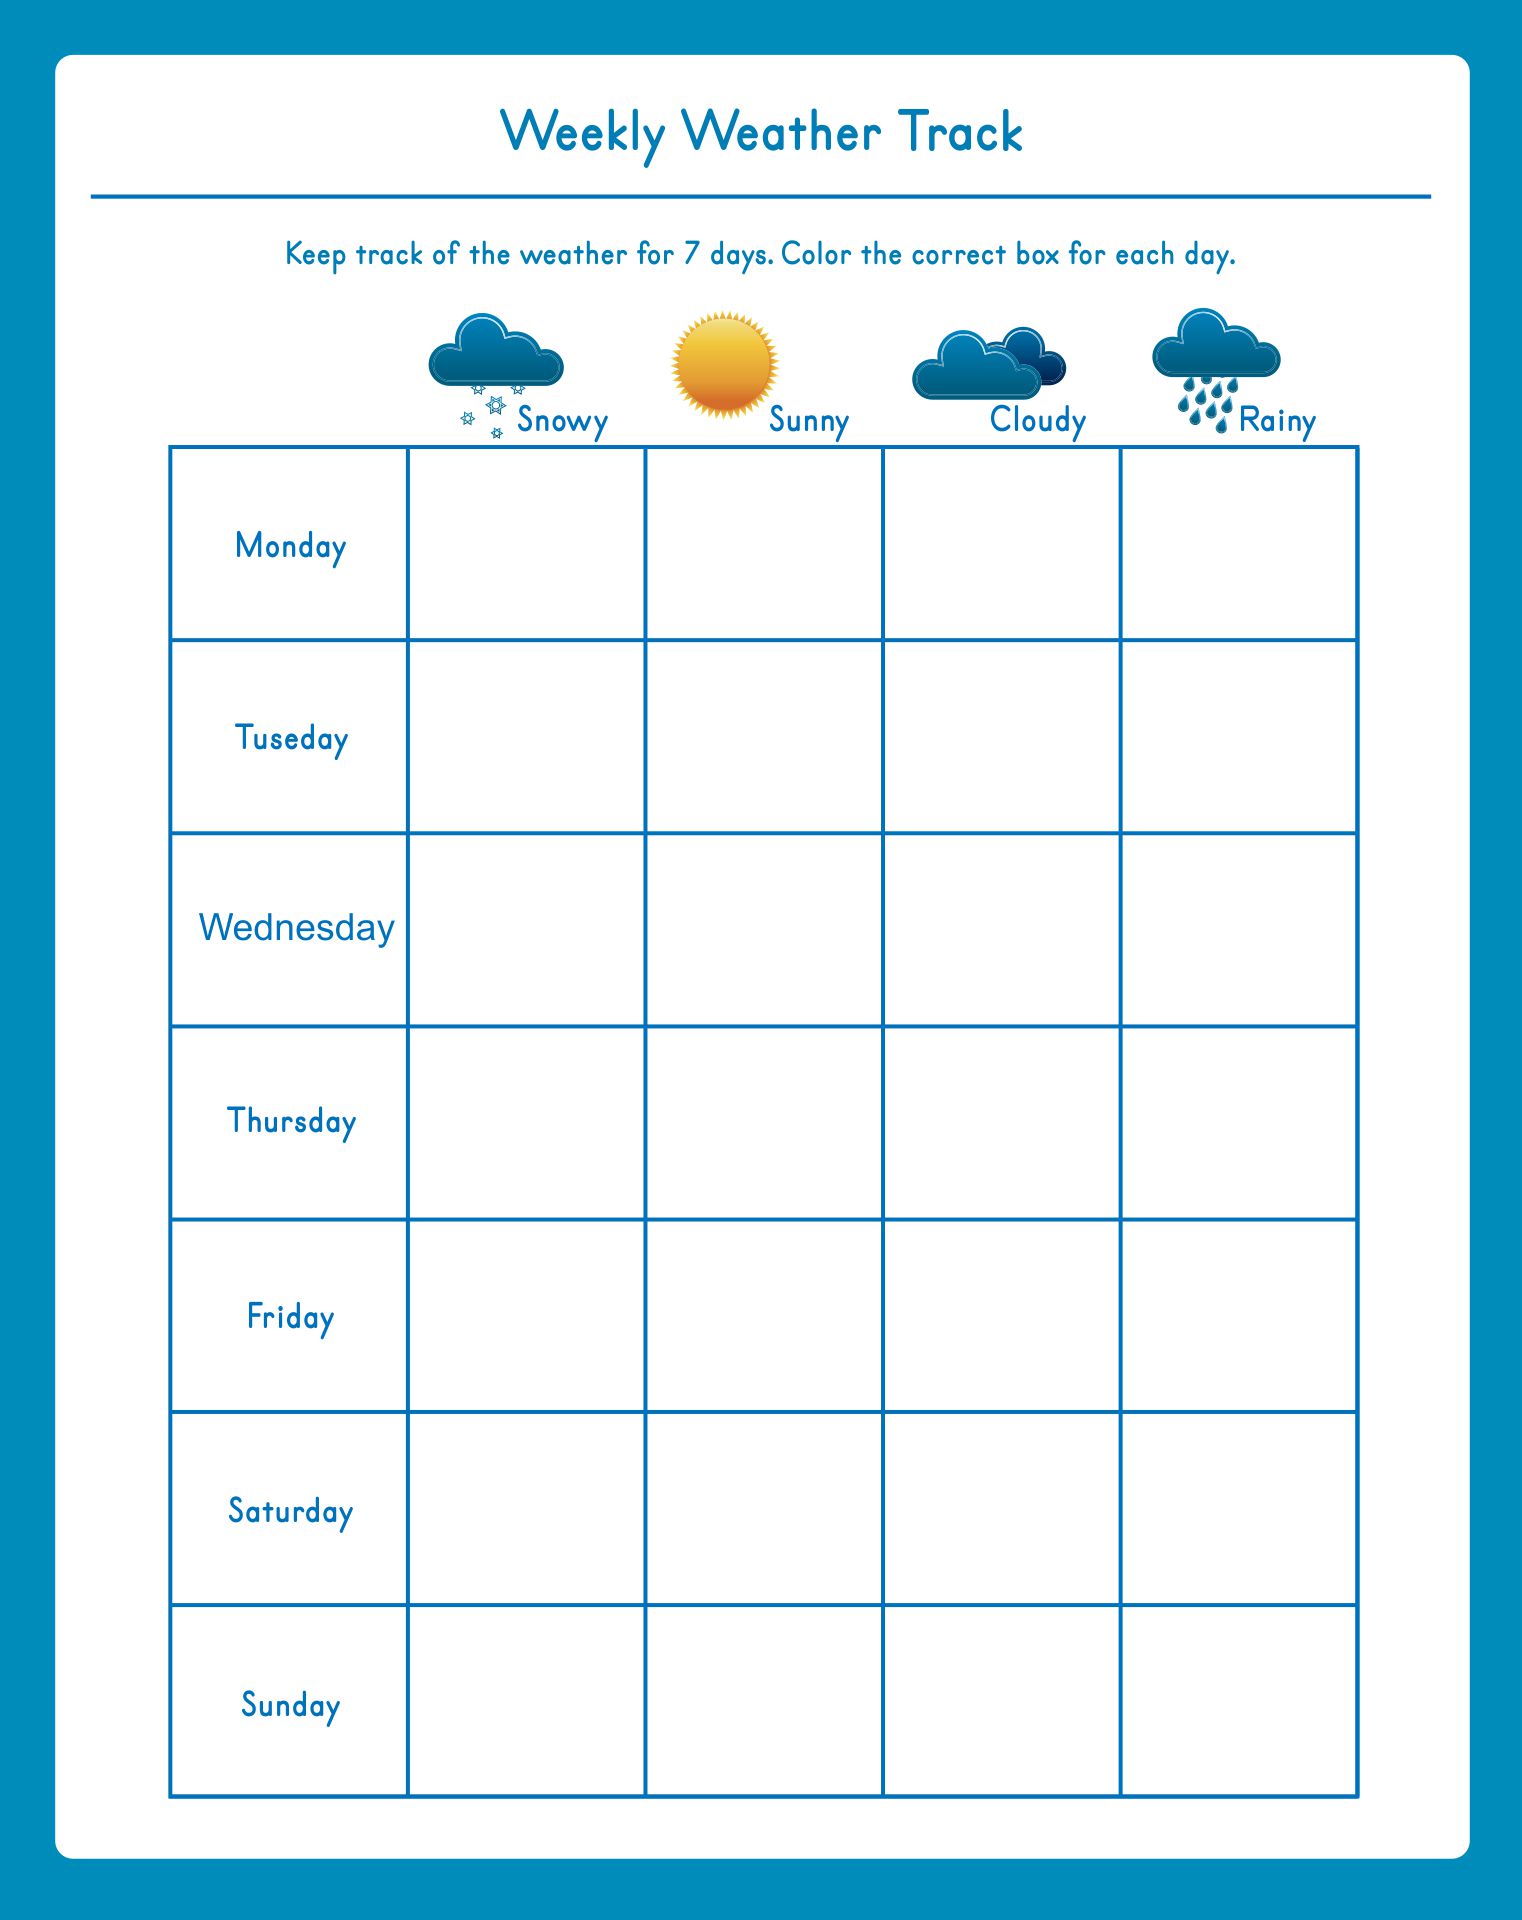
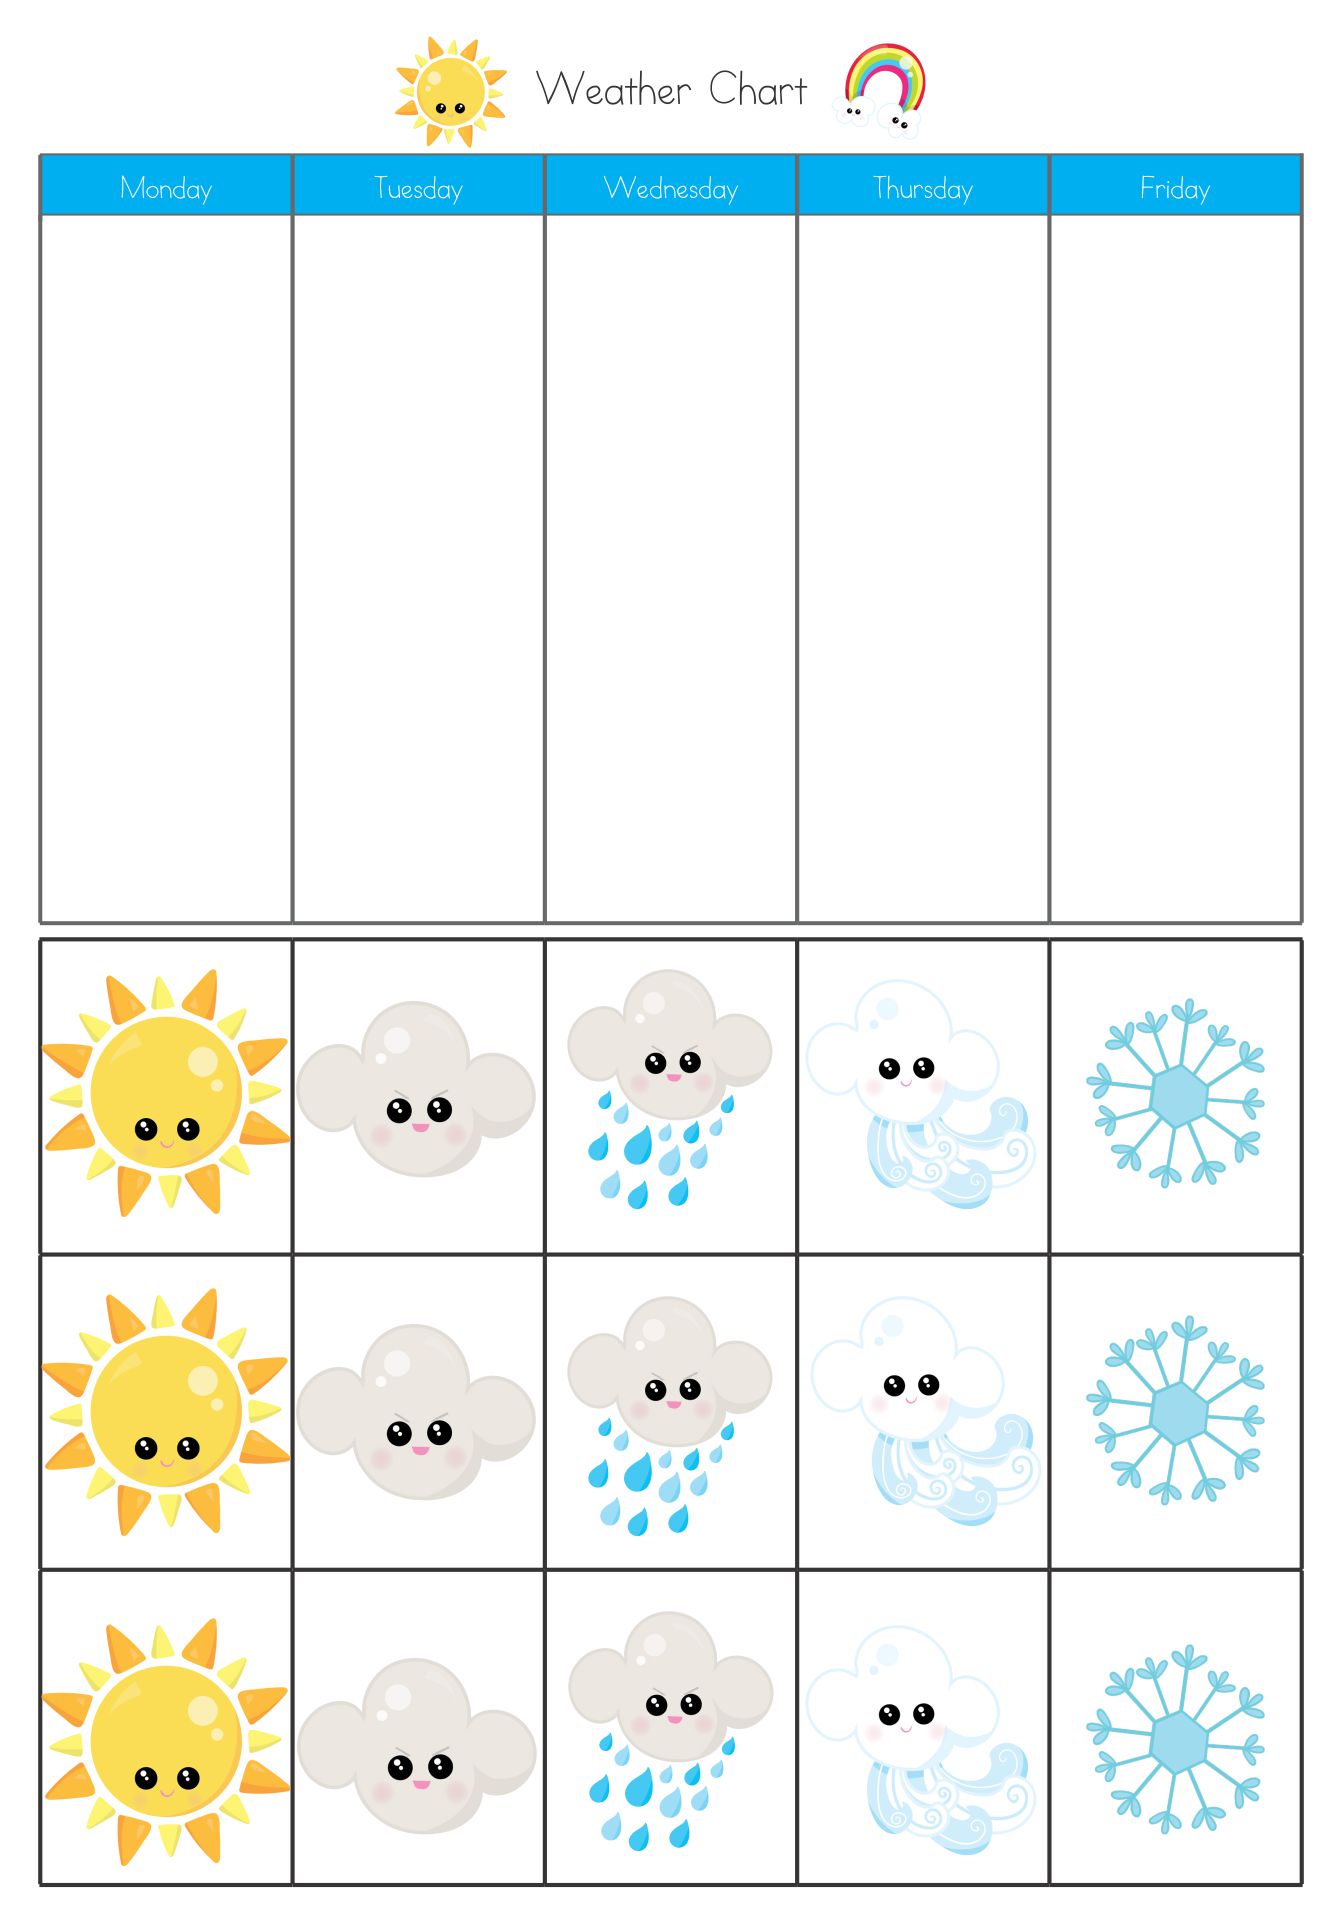
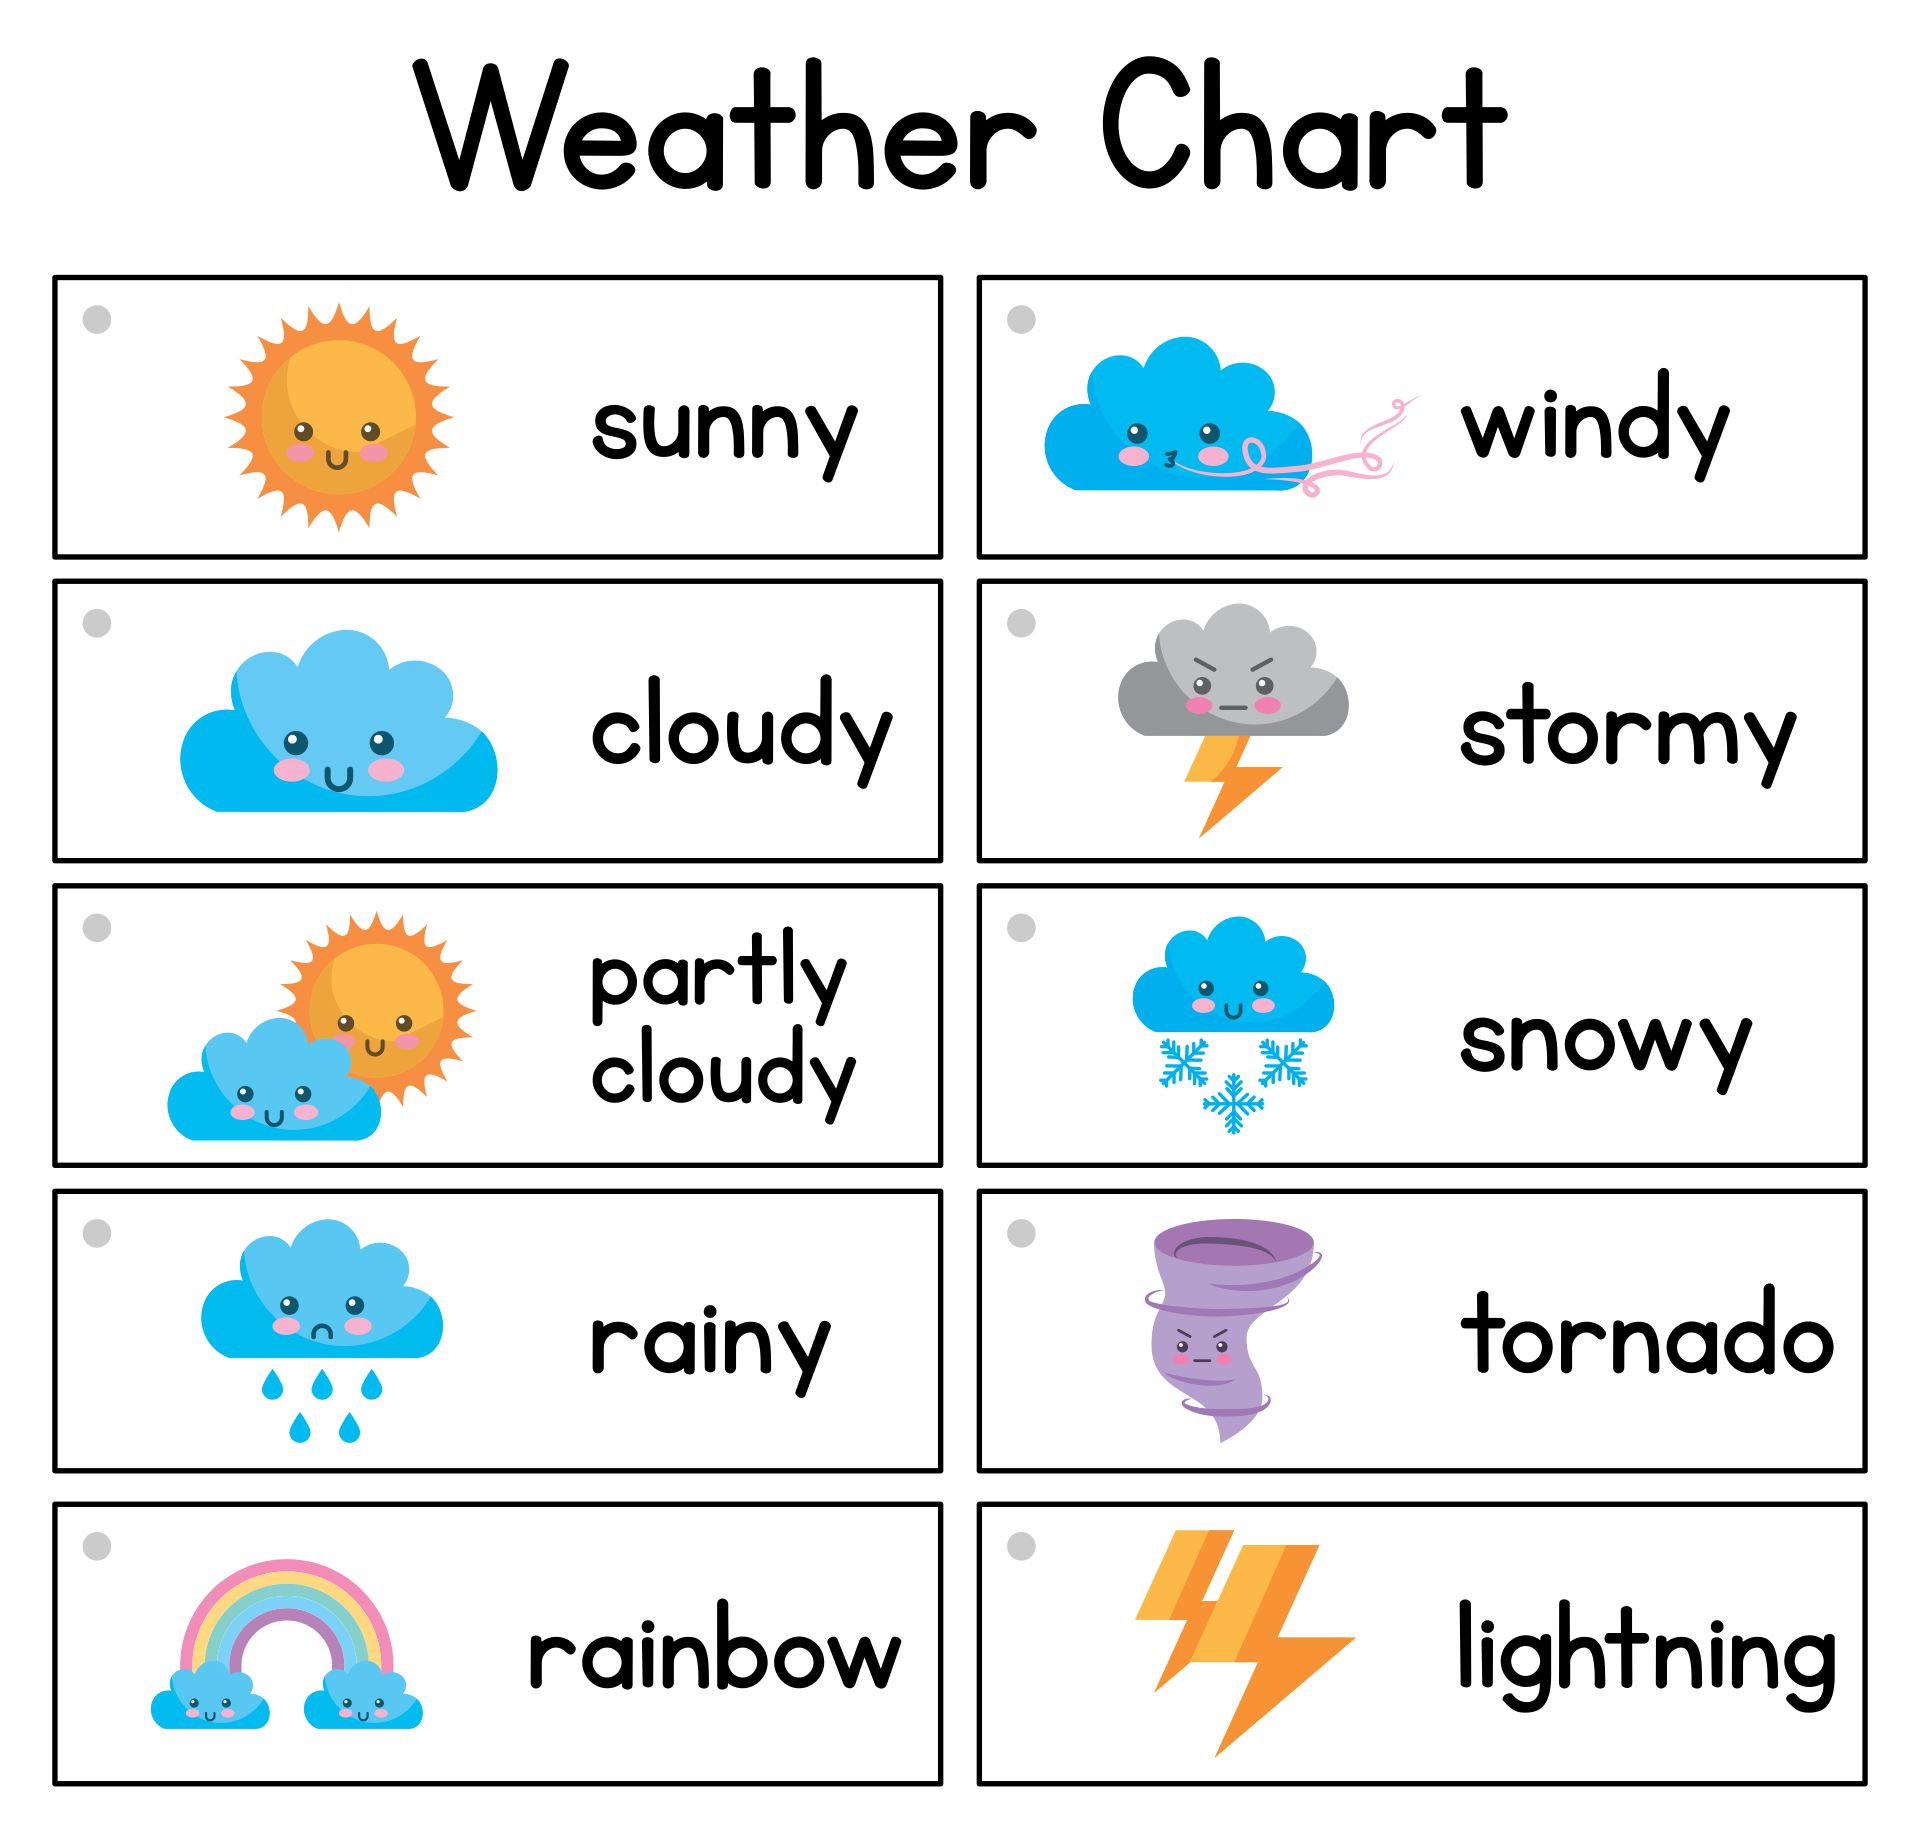
We make learning about weather engaging for little ones by designing colorful and interactive printable weather charts. These help kids track daily weather patterns and learn weather vocabulary. Charts come with symbols and stickers so kids can mark the weather each day. Fun and educational, these charts boost understanding of weather in a hands-on way.

Printable Weather Chart For Kindergarten
 Kindergarten Weather Chart Printable

 Preschool Weather Chart Graph

 Preschool Weather Chart Printable

 Preschool Weather Chart Graph

 Weather Graphs Printables

 Free Printable Weather Chart For Kindergarten

 Free Printable Weather Cards For Kindergarten

 Weather Chart For Preschool Classroom Printable

How to Read the Weather Chart?
Weather charts are very easy to read. However, first, learn about these things because these are the basis for being able to read a weather chart.
- The concept of precipitation: Precipitation is important data presented on the weather chart. So, you need to understand the basic concept of precipitation. Precipitation is water that falls to the earth such as rain, snow, and rain mixed with snow.
- Air pressure: Another thing to learn is low and high-pressure systems. High air pressure is related to dry weather because the air is very dense. High air pressure makes the weather sunny. Meanwhile, low air pressure is the opposite of high air pressure.
After understanding the two basic things above, you are now ready to read the weather chart.
- First, look for a weather chart. You can use a weather chart in a video or a printed weather chart. However, we recommend that you use a weather chart on a small area first. This is because reading weather charts for locations that are not large will be easier.
- Then, look at the various elements on the weather chart such as locations, patterns, arrows, colors, numbers, and lines. All signs are important to interpret.
- After that, start reading the air pressure. The air pressure is presented in several values on the weather chart. So, the average air pressure is 1013 mb, the high air pressure is 1030 mb, and the low air pressure is 1000 MB.
- Furthermore, you also have to study the symbol of the air pressure to be able to read it. So, check the isobars section. Isobars are an indication that the area has average air pressure. Isobars are very important for determining wind direction and wind speed.
- Learn the various other symbols on the weather chart such as clouds (the circle symbol in the center), temperature (celsius), isotherms, and isotachs.
The results of reading this data can help children determine weather conditions and the next season. They can write all this data on a season chart worksheet. So, weather charts are also a great way to help children develop their understanding of the seasons.
More printable images tagged with:

Have something to tell us?
Recent Comments
This printable weather chart for kindergarten is a helpful tool that allows children to visually learn about different weather conditions and develop their observation skills, fostering a deeper understanding of the world around them.
The printable weather chart for kindergarten is a useful visual tool that helps young children understand and track different weather conditions, promoting their observational and language skills.
The printable weather chart for kindergarten is a valuable tool that allows children to explore and understand different weather conditions, enhancing their knowledge and observation skills.